
All publicly traded U.S. corporations are required to submit Form 10-Q to the SEC quarterly. However, one crucial thing to note about these 10-Q filings is that they are typically unaudited.
So, what’s the importance of looking at these filings and what kinds of information might they contain? Well, 10-Qs provide valuable information on a company’s financials and operational health, while also analyzing these financials in detail along with risks that the company might hold. In this article post, we will discuss the different disclosures and information that you can research and analyze in 10-Q filings to decide if a particular company is a good investment or not.
Financial Statements
Arguably, one of the most important contents contained in Quarterly filings is the company’s financial statements. These include the company’s balance sheet, income statement, and cash flow statement. If you’re not familiar with these topics, a brief overview is provided below of what is contained in each and their importance in the financial world:
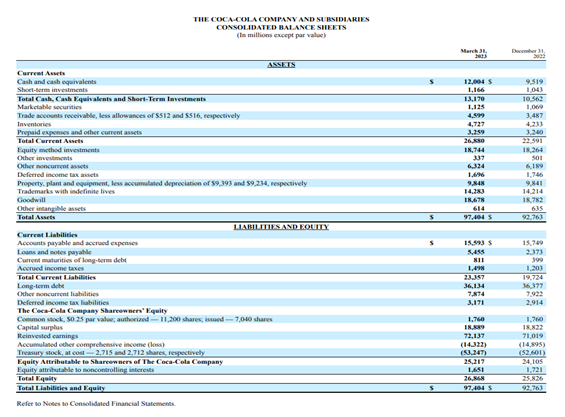
1. Balance Sheet – A balance sheet is a financial statement that shows a sort of snapshot of a company’s financial position at a particular point in time. It presents a summary of the company’s assets (what a company owns), liabilities (what a company owes), and equity (the value of a company if liabilities were subtracted from assets). Balance sheets are important for investors to assess the health of a company.
Fig 1: An example of Coca-Cola’s balance sheet in their 10-Q filings
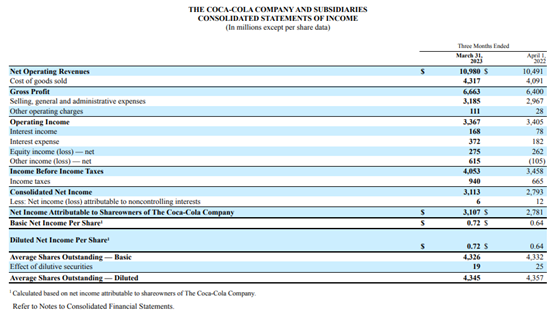
 2. Income Statement – An income statement is a financial statement that shows the profits and losses of a company. It includes the amount of money the company spent (expenses) and the amount of money the company made (revenues), and all this information is described in detail. This allows investors to analyze the profitability of a company and compare its performance with competitors.
Fig 2: An example of Coca-Cola’s income statement in their 10-Q filings
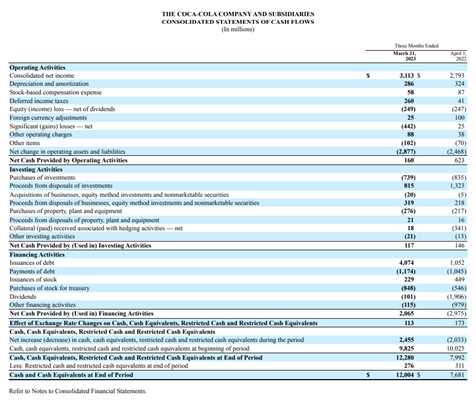
Cash Flow Statement – A cash flow statement is a financial statement that shows how cash flows in and out of a company over a specific period. This includes information on the companies operating activities (money spent and received on suppliers, customers, and goods), investing activities (investments into equipment or companies), and financing activities (cash received or spent from stock issuing or paying dividends). This gives investors the ability to look into a company’s liquidity, decision-making, and cash flow.
Fig 3: An example of Coca-Cola’s cash flows statement in their 10-Q filings
Having this kind of detailed information about a company every quarter is important for investors and other stakeholders to make informed decisions about the company. By analyzing the financial statements in 10-Q filings, investors can assess the company’s financial health, profitability, and cash flow position.
Using Financial Ratios to Analyze SEC Filings
Using the information from the financial statements, investors are able to calculate and compare financial ratios, evaluate a company’s revenue and profitability, identify any trends and company consistency, assess different risks, and conduct different kinds of valuation analyses.
Coca-Cola Financial Ratios Examples
Here are some examples of different financial ratios that can be used to analyze Coca-Cola SEC filings:
- Debt-to-Equity Ratio, which measures how much of a company’s operations are being funded by borrowed money, calculated by: total liabilities/total shareholder’s equity.A debt-to-equity ratio can be used by investors to figure out a company’s potential risk. Typically, an ideal debt-to-equity ratio is below 1.0, indicating a healthy financial position. Conversely, a ratio exceeding 2.0 is generally seen as risky. When the debt-to-equity ratio is negative, it signifies that the company’s liabilities outweigh its assets, rendering it highly precarious.Coca-Cola Example: $70,536 (million)/$26,868 (million) = 2.63 debt-to-equity ratio
- Earnings per Share, which measures the financial performance of a company, and calculated by: net income/weighted average of the number of common outstanding shares (an outstanding share is a stock held by a shareholder).The earnings per share can be used by investors to figure out the value of a company. A higher EPS is typically better and suggests that a company is making greater profits per outstanding share. Investors typically look for consistent EPS growth over time and compare a company’s EPS with its industry peers and benchmarks.Coca-Cola Example: $3,113 (million)/$4,326 (million) = $0.72 earnings per share
- Price-Earnings Ratio (PE Ratio), which measures how much investors are willing to pay for a company’s earnings. It’s calculated by: stock price/average earnings-per-share
(averaged over the past four earning releases)The price-to-earnings ratio can be used by investors to measure potential growth. A low PE ratio means that investor confidence in the stock is low or there isn’t enough awareness for the stock. A high PE ratio could mean that investors are driving higher share prices while earnings remain low, or that the company might be poised for growth.Coca-Cola Example: $62.03/$2.27 = 27.33 price-earnings ratio - Current Ratio, which measures a company’s ability to meet short-term obligations. It’s calculated by: current assets/current liabilities.The current ratio can be used by investors to analyze a company’s liquidity. A current ratio that is below 1.0 shows that the company is having difficulty meeting its short-term obligations and a current ratio above 3.0 shows that the company may not be utilizing its current assets effectively. The interpretation of this ratio depends on the industry and business.Coca-Cola Example: $26,880 (million)/$1,5593 (million) = 1.72 current ratio
- Return on Equity, which measures how well the company uses shareholder money. It’s calculated by: net income (for 12 months)/total shareholder equity.Return on Equity can be used by investors to gauge the investment potential of a company. Return on Equity ratios (ROE) are typically healthy between 10 and 20%. Although a higher ROE, the better, having a higher ROE could mean that there are elevated levels of debt that should be evaluated including looking at industry benchmarks and the overall health of the companyCoca-Cola Example: $9,868 (million)/$25,217 (million) = 39.13% return on equity
All of these processes allow investors to make more informed investment decisions and better understand a company.
Management Discussion and Analysis
10-Q forms are designed to provide investors with a detailed look at a company’s financial health and performance. The Management Discussion and Analysis (MD&A) section is a critical part of this, as it offers insights into the company’s financial statements and other important factors. You can see an example of Coca-Cola’s MD&A section here.
The results of the operations section of the MD&A typically include a discussion of the company’s revenues, costs, and profitability, which can help investors understand how well the company is performing financially. This section may also provide a comparison to prior periods or industry benchmarks to help investors evaluate the company’s performance relative to its peers.
However, it’s important to note that the results of the operations section aren’t just a simple summary of the company’s financial statements. Instead, it may include an in-depth analysis of the factors driving the company’s financial results.
Coca-Cola MD&A Example
One example is when Coca-Cola breaks down its operating revenues and income by continent. Coca-cola also goes in-depth into its expenses, detailing what and where money was spent (such as in advertising, distribution costs, etc.). Furthermore, Coca-Cola compares a variety of crucial financials with previous years’ financials to give the reader a better understanding of the company’s improvements and setbacks.
The section may also discuss how changes in the economy or industry trends have affected the company’s sales, or how strategic decisions made by the company have an impact on its costs and profitability. This type of analysis can provide valuable insights into the company’s operations and strategy, which can be useful for investors trying to assess its future potential.
The liquidity and capital resources section of the MD&A is another important component, as it offers a detailed look at the company’s ability to meet its financial obligations and fund its operations.
This section may discuss the company’s cash flow, debt levels, and sources of financing, as well as any significant capital expenditures that may be planned for the future. This information can be particularly important for investors who want to evaluate the company’s financial stability and its ability to invest in future growth.
In the case of Coca-Cola, they discuss specifically how they are in litigation with the IRS for 2007-2009 taxes, on top of discussing their debt and cash flows. They talk about the different potential outcomes, and how those outcomes might affect the company’s liquidity and financial situation. This goes to show the types of detailed information that can be provided in the MD&A section for readers.
Finally, the MD&A may also discuss risks and uncertainties facing the company, such as changes in regulations or competitive pressures. This type of information can be important for investors trying to evaluate the potential risks associated with investing in the company.
Additionally, the MD&A section may provide forward-looking statements about the company’s future performance and expectations, which can help investors assess its long-term potential.
Risk Factors
These 10-Q filings also include a section detailing different risk factors. These factors include things such as market and economic conditions, competition that the company might face, or regulatory changes. The risk factor section is a crucial part of the 10-Q filings as it helps investors to make informed decisions by providing an understanding of the potential risks and uncertainties the company is facing.
For instance, market and economic conditions are external factors that can have a significant impact on a company’s performance. A company that relies heavily on exports might face challenges if there are changes in the exchange rates or political tensions between trading countries. Similarly, a downturn in the economy can affect consumer behavior, leading to decreased demand for products or services, which can negatively impact a company’s revenue and profitability.
Competition is another factor that can significantly affect a company’s financial performance. The section on risk factors details the competitive landscape, including the number of competitors, their market share, and the intensity of the competition. For example, a company that operates in a highly competitive industry such as technology might face stiff competition from established players or new entrants.
Regulatory changes are also a significant risk factor that can affect a company’s operations. These changes can impact a company’s costs, profitability, and revenue. For instance, a company operating in the healthcare sector might face changes in regulations related to drug pricing or reimbursement policies, which might lower revenues. In contrast, a company operating in the financial sector might be affected by changes in regulations related to lending practices or capital requirements, which could also decrease revenues.
By providing an overview of the various risk factors, the risk factor section of the 10-Q filing enables investors to assess the potential risks associated with investing in the company. However, it also highlights the steps that the company might be taking to try and mitigate these risks.
All in all, the risk factors section provides investors with more insight and information about a company and any risks they might take on by choosing to invest in them.
Submitting 10-Q Filings
Submitting 10-Q filings is a crucial financial reporting requirement for public companies in the United States. These filings provide a comprehensive snapshot of a company’s financial performance and condition for a specific quarter, and it is important that the fillings are as accurate as possible for investors. As a result, the Sarbanes-Oxley Act was passed in 2002, and states that only the company’s “principal officers”, such as the CEO and CFO, can sign off on these filings.
Specific deadlines for submitting the 10-Q filings are based on the end of each fiscal quarter:
Under a fiscal year-end of 12/31, the quarters end at these times:
- The first quarter ends on March 31
- The second quarter ends on June 30
- The third quarter ends on September 30
- At the end of a fiscal year (December 31), instead of submitting a 10-Q filing, companies submit a 10-K filing instead, detailing annual data and financials.
Based on these quarter-end dates, large accelerated filers are required to submit 10-Q filings within 40 or 45 days after the quarter ends. Large accelerated filers are generally defined as companies with a public float of $700 million or more, and annual revenues of more than $100 million. In this case, public float refers to the portion of a company’s shares that is freely tradable on the open market.
For smaller reporting companies, they are required to submit 10-Q filings within 45 or 50 days after the quarter ends. Smaller reporting companies are defined as companies that do not meet the requirements of a large accelerated filer. Companies with a public float of less than $75 million also qualify as smaller reporting companies, regardless of revenue.
Company Financial Health
In conclusion, 10-Q filings provide valuable information on a company’s financials and health. These filings contain important financial statements such as balance sheets, income statements, and cash flow statements that give investors the ability to assess a company’s financial health, profitability, and cash flow position.
Additionally, the Management Discussion and Analysis (MD&A) section offers insights into the company’s financial statements, strategy, risks and uncertainties, and future potential. The risk factor section is another critical part of the 10-Q filings that helps investors understand the potential risks and uncertainties the company is facing.
By analyzing the information contained in 10-Q filings, investors and other stakeholders can make informed decisions about investing or doing business with the company.