
When every potential investor begins to analyze a company, one of the first things they look at is the company’s 10-K. The Form 10-K, also known as the annual report, provides a brief overview of the company including potential risk factors, legal proceedings, as well as financial statements for the most recent fiscal year. A company’s 10-K reveals its current assets, liabilities, how the company is utilizing its money, and the company’s financial growth.
After the end of each fiscal year, all public companies, per SEC regulations, are required to submit their 10-K within 60-90 days of the previous fiscal year’s end, depending on the size of the company.With most public companies’ fiscal year coming to an end on December 31, they are required to formally submit their 10-K, by March 31.
If a company cannot meet the SEC filing deadlines, it will file a Form 12b-25, which is a notice of late filing and typically an indicator of a company’s poor performance. As a result of the due dates enforced by the SEC, 10-K’s filed in the first quarter of 2023 contain the financial performance of companies in 2022.
With a 10-K being one of the most viewed documents a company releases, it is important to understand why they are so important and how they impact a company and the overall market. In this article, we will also be focusing on how the release of a company’s 10-K has affected the Dow Jones Industrial Average and the National Association of Securities Dealers Automated Quotations (NASDAQ) Composite Index.
The DJIA is a stock market index that tracks 30 of the largest publicly owned blue-chip companies that are traded on the New York Stock Exchange (NYSE) and the NASDAQ stock exchange. The NASDAQ Composite Index is a market cap-weighted index that contains more than 3,700 stocks, heavily consisting of companies in the technology sector, listed on the NASDAQ Stock Exchange.
Listed below are the top 5 most impactful 10-K’s, filed in 2023, that have caused massive changes to occur in either the market or in company operations and stock price.
1. Goldman Sachs’ 10-K
Goldman Sachs is an American multinational investment fund and financial services company. It is currently the second-largest investment bank in the world and manages around $2.54 trillion in assets.
As an industry leader, Goldman Sachs is expected to outperform the market because they possess a higher level of information about the market and its condition than the general public. In its 10-K, filed in 2023 for FYE 2022, Goldman Sachs stated that it experienced a 10.2% return on investment, which is higher than the market’s return of -16.15%. This higher rate of return differs from the previous year where the market had a 26.89% return on investment and Goldman Sachs had a 23% return.
This 10-K was impactful not because it influenced massive changes within the company, but instead because it delivered a message to the public. In 2021, only a very limited select few investment banks were able to meet expectations and outperform the market, and Goldman Sachs, a market leader, was not one of them. The year 2021 told the general public that investment banks could not keep up with the market and were failing at their sole purpose.
However, in 2022, Goldman Sachs’ 10-K reinforced its dominance and the overall dominance of investment banks over the market. The release of the 10-K told the public that Goldman Sachs along with many other investment banks were back, the times of the market outperforming it were long gone, and the market is not as predictable and safe as it was the previous year.
Goldman Sachs is traded on the NYSE and is a major player in indexes with it being included in the DJIA since April 2, 2019, and it controls 7.36% of the average, which is the second largest amount of control over the index only behind UnitedHealth Group. With the release of Goldman Sachs 10-K for 2022, since no strong and immediate change occurred to the company’s stock price, the price per share of the DJIA was hardly affected. Instead, the release of the 10-K proved that Goldman Sachs was back on top and outperforming the market which lent itself to showing the long-term security of the company and the DJIA as a whole.
It proved that like Goldman Sachs, the DJIA is stable, reliable, and back on top with the Average increasing $72.17 from $32816.92 to $32889.09 within 3 days of the report’s release. Many of Goldman Sachs’ largest holdings are both listed and are major players on the NASDAQ stock exchange, specifically Apple with a market cap of $2.067 trillion, Microsoft with a market cap of $1.788 trillion, and the Invesco QQQ Trust Series 1 which is an ETF that tracks the NASDAQ top 100.
Through Goldman Sachs 10-K reporting that it performed above the market, it indicates that many of its major holdings listed on the NASDAQ also performed well. Since its major holdings possess a large amount of influence on the market cap-weighted NASDAQ Composite Index, news of the resurgence and stability of Goldman Sachs, benefited the index by showing that the largest companies can still perform well even in a down market and they are overall stable, meaning the Composite Index is becoming more secure.
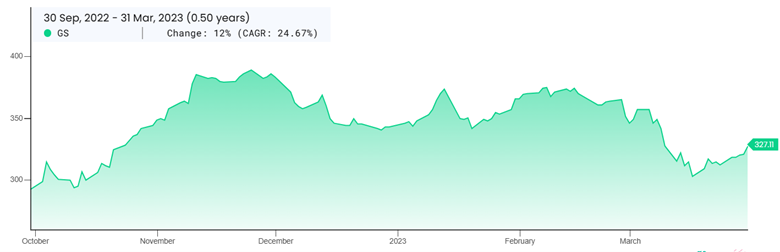
Goldman Sachs’ Stock Price Each Quarter:
| End of The Third Quarter | End of Previous Fiscal Year | Day Before The Selected Report Was Filed: | The Next Open Market Day After The Selected Report Was Filed | 1 Month After The Report Was Filed | End of The First Quarter | |
| Date | 9/30/2022 | 12/30/2023 | 2/23/2023 | 2/27/2023 | 3/24/2023 | 3/31/2023 |
| Price Per Share | $293.05 | $343.48 | $363.54 | $365.53 | $312.57 | $327.11 |
Goldman Sachs’ Stock Price Performance Graph:
2. Silvergate Capital Corporation’s 10-K
Silvergate Capital is a California bank that offers cryptocurrency services. This year Silvergate filed a form 12b-25 so that it could have 2 weeks of extended time to file its annual report due to its accounting firm needing to audit procedures. Upon word getting out of the delayed filing, Silvergate Capital’s stock price dropped by 57.72% within a day. This brought Silvergate’s total stock price down 95.7% within the past year.
Silvergates Capital didn’t end up filing a 10-K, which showed just how much the company was hurt in 2022 by its stake in cryptocurrency. Overall in 2022, the global cryptocurrency market decreased by 64.1% from $2.3 trillion to $829 billion.
Due to FTX Trading, a cryptocurrency trading platform and hedge fund, which had significant deposits in Silvergate, declaring bankruptcy, Silvergate lost a large sum of money, leading to the company suffering. Even almost 7 months after the end of the 2022 fiscal year, Silvergate Capital has still not filed a 10-K causing the NYSE to notify the company of their non-compliance. Since then Silvergate stated that the company’s 10-K’s will be delayed pending a current SEC investigation.
Even though Silvergate Capital has not released a 10-K, news about the delaying of the 10-K was very impactful nonetheless. Silvergate Capital’s 10-K was impactful because it showed just how negatively cryptocurrency has influenced the market in 2022.
Silvergate’s heavy investment in the cryptocurrency market caused the bank to crumble down from its former glory, with it even entering the transition to be delisted on the New York Stock Exchange. No filing of Silvergates’s 10-K serves as a warning to the public to remove themselves from the cryptocurrency market and that filing a 10-K with poor numbers is still better than filing no 10-K at all.
Silvergate Capital Corporation used to be traded on the NYSE before it was delisted on May 11, 2023. With Silvergates influence and holdings decreasing exponentially after it failed to file its 10-K and became investigated by the SEC, the level of threat it was posing to competing banks has fallen.
Within the DJIA, there are 3 banks: JP Morgan Chase, Goldman Sachs, and American Express. With the failure of Silvergate Capital Corporation, each of these 3 banks lost a competitor and absorbed some of its clients which led to each of the banks benefitting and growing. The growth of each of these 3 banks ultimately positively aided the DJIA.
The NASDAQ Composite Index benefited heavily from Silvergate Capital Corporation being listed on the NYSE. Since the Composite Index includes the stock of every company listed on the NASDAQ, if Silvergate was to be listed on the NASDAQ, due to its massive stock price crash, it would have pulled down the Composite Index.
Silvergate’s failure to file its 10-K benefited the banks included in the DJIA, it also helped the banks listed on the NASDAQ, by decreasing the number of competitors and allowing its clients to transfer over to other banks, which in return benefited the Composite Index.
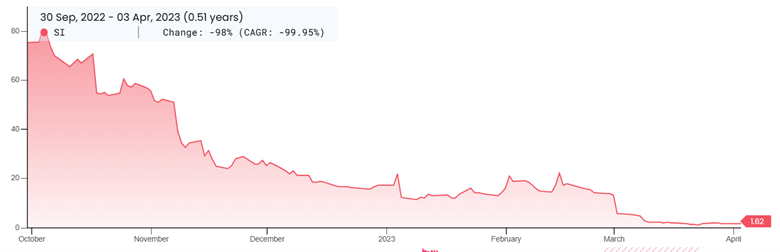
Silvergate Capital Corporation’s Stock Price Each Quarter:
| End of The Third Quarter | End of Previous Fiscal Year | Day Before The Notice of Delayed Filing Was Filed | Day After The Notice of Delayed Filing Was Filed | End of The First Quarter | Next Open Trading Day 1 Month After The Notice of Delayed Filing Was Filed | |
| Date | 9/30/2022 | 12/30/2023 | 2/28/2023 | 3/2/2023 | 3/31/2023 | 4/3/2023 |
| Price Per Share | $75.35 | $17.40 | $13.91 | $5.72 | $1.62 | $1.62 |
Silvergate Capital Corporation’s Stock Price Performance Graph:
3. Robinhood Market’s 10-K
Robinhood Markets Inc. is an American financial services company that performs commission-free trades of stocks, funds, and cryptocurrencies. Currently, Robinhood is the third largest online stock broking company in the world with around 13 million brokerage accounts and $62 billion in total assets under management. In Robinhood’s 10-K, under the section titled “Risks Related to Our Business”, the company revealed that the SEC has begun to focus on company operations and enforce new laws that will impact its business due to stopping the trade of specific securities in January 2021.
In January 2021, Robinhood stopped the trading of specific securities, specifically GameStop and AMC, and cited market volatility as its reason. The stopping of trade benefited hedge funds and investment banks by limiting their losses as a result of shorting these companies, while simultaneously hurting the common investor by not letting them participate.
Days after Robinhood released its 10-K for 2022 that mentioned an increased SEC focus, news broke about Robinhood paying up to $10.2 million to settle customer outrage about the stopping of trades. Robinhood’s 10-K for 2022 was not impactful in terms of affecting stock price after its release but rather impactful in the message it told the public. The mention of an increased focus and $10.2 million in penalties showed the public that the SEC will not side with big banks and hedge funds and let them have uncontrolled power any longer, but instead protect the common investor by increasing the SEC presence and punishments towards violators.
Robinhood Market is traded on NASDAQ and within the company’s 10-K, it reminded the public about the company’s decision to stop the trading of GameStop and AMC Theaters securities. At the time of the company’s decision, it created negative media attention and a poor public perception of Robinhood leading many investors to turn to financial services companies that have not stopped the trade of those specific securities so that they may take part in the action.
By bringing that topic back up in the 10-K as a result of the new SEC focus, it could remind investors about how Robinhood chose to protect big banks instead of the common investor, which are the vast majority of its users, and lead them to a competing trading platform once again.
Two of the banks included in the DJIA have trading platforms: Goldman Sachs has Marcus and JP Morgan Chase has Self-Directed Investing. Both of these systems are trading platforms that users of Robinhood could transition to, including others like TD Ameritrade and Charles Schwab and their switch would benefit the larger companies of Goldman Sachs and JP Morgan Chase and the DJIA as a whole. Many of Robinhood’s biggest competitors are either not listed on the NYSE or NASDAQ, or only on the NYSE.
No direct competitors of Robinhood are listed on the NASDAQ- this may explain Robinhood’s release of its 10-K had no large impact on the Composite Index. With a possible drop in Robinhood users, many of the companies listed on the NASDAQ could have experienced a lower trading volume, meaning a lower level of interest, and hurting the Composite Index.
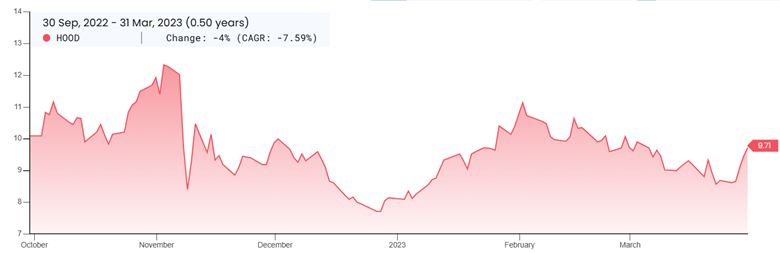
Robinhood Market’s Stock Price Each Quarter:
| End of The Third Quarter:
| End of Previous Fiscal Year | Trading Day Before The Selected Report Was Filed | Day After The Selected Report Was Filed | 1 Month After The Report Was Filed | End of The First Quarter | |
| Date | 9/30/2022 | 12/30/2023 | 2/24/2023 | 2/28/2023 | 3/27/2023 | 3/31/2023 |
| Price Per Share | $10.10 | $8.14 | $9.59 | $10.07 | $8.61 | $9.71 |
Robinhood Market’s Stock Price Performance Graph:
4. Meta Platforms Inc 10-K
Meta Platforms, created in October 2021 after the name was changed from Facebook, is the parent company of 3 of the largest social media platforms in the world: Facebook, Instagram, and now Threads. Meta’s 10-K, filed in 2023, stated that they will be undergoing a $40 billion stock buyback throughout 2023. A stock buyback means that Meta will be decreasing the number of outstanding shares on the market and increasing the value of the stock by buying back shares from existing shareholders, which is a good sign for investors.
In addition to the buyback, the annual report showed that Meta believes their expenses will range from $89 to $95 billion which is lower than the previous expectations of $94 to $100 billion due to Facebook letting go of about 11,000 employees in November.
After Meta released the 10-K, the stock price rose 19% in premarket trading going from $153.12 per share to $181.71 per share. The 10-K was impactful because it showed Meta’s growing belief in the company. In addition to a $40 billion stock buyback in 2023, Meta bought back $28 billion in stocks in 2022, which shows that the company believes it is undervalued. The report was impactful because not only did it cause a large fluctuation in the company’s stock price but it told the public that Meta believes its future is bright and secure with the Metaverse.
Meta is the 9th largest company traded on the NASDAQ stock exchange with a market cap of $319.80 billion. Meta’s reporting of its financials from 2022 caused the stock to rise dramatically, and with Meta’s stock rising many of the NASDAQ indexes it is included in also rose, such as the S&P 500.
With Meta being a major player in the market due to its large market cap, the NASDAQ Composite Index, a market cap-weighted index, benefited as a result of Meta’s rising. Meta has no direct relationship to the DJIA with it not being included as one of the 30 major companies and no financial services companies included in the index owning a major stake.
The major institutional shareholder of Meta, BlackRock, who owns 6.6% of Meta’s outstanding shares, is listed on the NYSE and is a direct competitor of numerous companies on the DJIA such as Goldman Sachs and JP Morgan. With Meta performing positively and the number of available stocks decreasing as a result of a $40 billion buyback, BlackRock’s shares are becoming and will continue to become increasingly valuable, which hurts its current competitors listed in the DJIA and limits the Average’s growth.
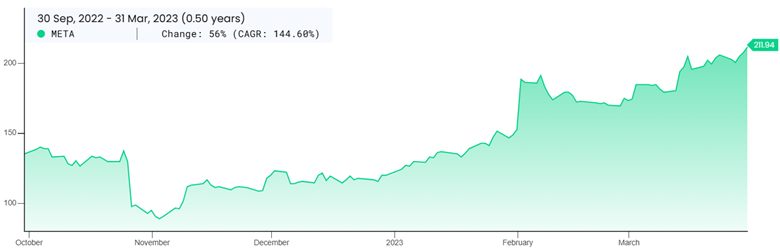
Meta Platform’s Stock Price Each Quarter:
| End of The Third Quarter | End of Previous Fiscal Year | Day Before The Selected Report Was Filed | Day After The Selected Report Was Filed | 1 Month After The Report Was Filed | End of The First Quarter | |
| Date | 9/30/2022 | 12/30/2023 | 2/1/23 | 2/3/2023 | 3/27/2023 | 3/31/2023 |
| Price Per Share | $135.68 | $120.34 | $153.12 | $186.53 | $202.84 | $211.94 |
Meta Platform’s Stock Price Performance Graph:
5. Silicon Valley Bank (SVB) Financial Group’s 10-K
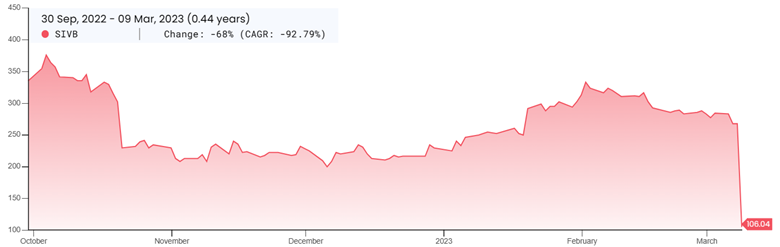
The 18th largest bank in America, Silicon Valley Bank is a state-chartered commercial bank. SVB manages $212 billion in total assets while having a market cap of $28.12 billion. On February 24, 2023, SVB released its annual report and on March 8, 2023, just 12 days later, the bank began to collapse.
On March 8th the price of a share was $267.83, but just 1 day later on March 9th, the price was $106.04. The drop was so dramatic that trading was halted until March 28th when it was $0.90 per share. It was the second largest bank failure in US history behind Washington Mutual in 2008.
In SVB Financial Group’s 10-K, the company revealed a low average return on assets of 0.7% which was lower than the previous year’s average return rate on assets of 0.84%. This average return rate was lower than competing banks, which convinced customers of the bank to be open to the possibility of moving their assets to competitors for a higher average return rate. 12 days after the release of the 10-K, filed in 2023, interest rates rose and the rise in rates in conjunction with customers considering the possibility of moving banks caused a bank run to occur.
SVB’s 10-K was impactful because it showed just how much a company’s position and the market are dependent on each other to succeed. The 10-K could not have caused the demise of SVB by itself, but the poor financials and lack of company improvement it showed with growing interest rate caused customers to pull their money out leading to SVB’s downfall.
SVB Financial Group is traded on the NASDAQ, but ever since the bank experienced a bank run the trading volume the company has experienced has dropped dramatically. The fall of SVB Financial Group has had similar effects on the NASDAQ Composite Index and Dow Jones Industrial Average as Silvergate Capital Corporation had but only magnified. Compared to Silvergate, SVB is massive with it managing hundreds of billions of dollars and being the 18th largest bank in America.
With this company crashing down and clients pulling their money, mainly large technology companies, SVB’s clients now need to put money into a new bank. With the DJIA including three banks, JP Morgan Chase, Goldman Sachs, and American Express, they would heavily benefit from tech companies like Etsy, Roblox, and Roku transferring over their money to them, which in return will boost the DJIA significantly.
The release of SVB’s 10-K, which led to its collapse through a bank run, hurt the NASDAQ. Many of the large companies that SVB managed the money for like Etsy and Roku are available on the NASDAQ and due to the bank run, the companies were not able to remove a significant amount of their cash assets at once.
Due to government intervention and the newly enforced regulations that came with it, much of the company’s cash is tied up and held, meaning that many companies cannot act as freely as they would like, hurting their business and bringing down the Composite Index.
Silicon Valley Bank Financial Group’s Stock Price Each Quarter:
| End of The Third Quarter:
| End of Previous Fiscal Year | Day Before The Selected Report Was Filed | Next Trading Day After The Selected Report Was Filed | Last Trading Day Before Being Halted | End of First Quarter | |
| Date | 9/30/2022 | 12/30/2023 | 2/23/23 | 2/25/2023 | 3/9/2023 | 3/31/2023 |
| Price Per Share | $335.48 | $230.14 | $289.01 | $285.93 | $106.04 | $0.90 |
Silicon Valley Bank Financial Group’s Stock Price Performance Graph:
All graphs are courtesy of Stratosphere.io