
Each year, every public company has to report to the Securities and Exchange Commission (SEC) and submit Form 10-Q, also known as a quarterly report. With so many companies filing these reports, it is often hard to see which 10-Qs are the most impactful.
The SEC Form 10-Q is an in-depth quarterly report that discusses a company’s financial performance for the previous 3 months. Each company’s 10-Q contains a breakdown of its assets, liabilities, shareholder equity, legal proceedings, and other financial information that details whether or not the company is meeting expectations.
The SEC, an independent federal agency that regulates and protects the market, requires that companies submit their quarterly reports within 40 days of the end of the financial quarter. Only the quarterly reports from the first three fiscal quarters of the year are required by the SEC, but sometimes large companies will file an additional 10-Q for the fourth quarter with the annual 10-K for due diligence. With this article focusing on 10-Qs filed in 2022, it means that the article’s scope is limited to quarterly reports from the 4th quarter of 2021 and the first three quarters of 2022.
An impactful 10-Q is defined in this article as a quarterly report that upon being released can be a precursor to massive changes to a company’s operations or stock price, and may lead to market-changing effects. Due to the impactful nature of the listed 10-Q’s, the article will analyze how the release of these quarterly reports affected the Dow Jones Industrial Average (DJIA) and NASDAQ Composite Index. The DJIA is a stock market index that tracks 30 of the largest publicly owned blue-chip companies that are traded on the New York Stock Exchange (NYSE) and the National Association of Securities Dealers Automated Quotations Stock Exchange (NASDAQ). The NASDAQ Composite Index is a market cap-weighted index that contains more than 3,700 stocks, heavily consisting of companies in the technology sector, listed on the NASDAQ Stock Exchange.
Listed below are the top 5 most impactful 10-Qs filed in 2022 that have led to changes in the market or a massive fluctuation in a company’s stock price.
1. SoftBank Group Corporation’s Second Quarter 2022 10-Q
SoftBank Group Corporation is a Japanese multinational holding company that upon releasing its 10-Q for the second quarter of 2022, revealed that it had a record loss of $23.4 billion. The report also revealed that its net asset value (NAV) was down $16 billion from the previous quarter. These losses marked the second straight quarter of enormous losses for SoftBank.
Upon releasing the 10-Q to the public on August 8, SoftBank had a market cap of about $66.56 billion, and within 1 day after reporting earnings, its market cap dropped down to $61.84 billion marking a total drop of $4.72 billion. Within 2 months of the announcement, on September 30, Softbank recorded its lowest market cap in recent memory of $52.455 billion, which was $14.105 billion lower than where the company stood before the second quarter report was released.
The reason for such massive losses could be tied to the fall of the technology industry and SoftBank’s large investments in technology companies and cryptocurrency, specifically Doordash, Uber, WeWork, FTX, and Coupang. Softbank’s 10-Q was so impactful because it forced one of the largest companies in the world to publicly declare a more defensive strategy moving forward due to abnormally risky investments; however, even with the new defensive strategy, SoftBank declared losses of $7.2 billion in the next quarter.
The report also revealed that a market shift is occurring away from large technology companies. It also alerted the public about the extreme volatility of cryptocurrency and helped boost the trend away from the crypto investments that were so popular in prior years.
Due to SoftBank Group Corporation being a Japanese company, it is not listed on the NYSE or NASDAQ. With the DJIA only focusing on 30 of the largest companies that are listed on American stock exchanges and SoftBank Group Corporation not even being listed on any American stock exchange, there is no direct relationship between the two.
With SoftBank releasing a quarterly report showing massive losses, the company’s only option was to sell some of its assets to free up capital. SoftBank sold $34 billion worth of Alibaba stock, a company listed on the NYSE, decreasing its stake in the eCommerce giant from 23.7% to 14.6%. In addition to selling Alibaba, SoftBank sold $1.69 billion of Coupang and dumped the remaining of its Uber holdings, which are both companies listed on the NYSE.
With a large quantity of each of these companies’ shares hitting the market, Uber, Coupang, and Alibaba experienced a slight decrease in stock price. This did hurt the DJIA and the market as a whole by decreasing members of the DJIA financial holdings, such as Goldman Sachs which has a 3.4% stake in Uber. SoftBank did not have a massive unloading of shares for companies listed on the NASDAQ; however, SoftBank does manage and invest the money of several companies listed on the NASDAQ.
SoftBank’s poor second quarter performance caused them to once again shrink from being the “NASDAQ Whale” they were in years prior. A decreased activity in investing in companies listed on the NASDAQ ultimately led to major changes in the market’s activity compared to what it saw in previous years. With major tech companies lacking the investment they typically received from SoftBank, companies listed on the NASDAQ Composite Index were negatively affected.
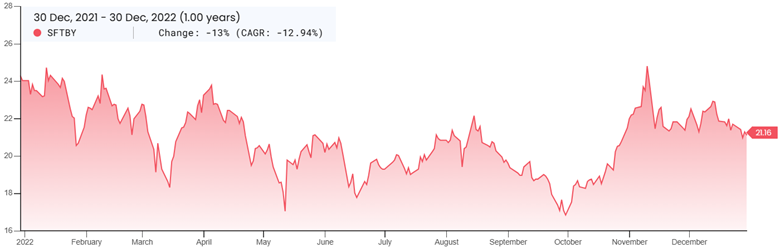
SoftBank Group Corporation Stock Price Each Quarter:
| End of Previous Fiscal Year | End of First Quarter | End of Second Quarter | Day Before The Selected Report Was Filed | Day After Selected Report Was Filed | 1 Month After The Report Was Filed | End of Third Quarter | End of Current Fiscal Year | |
| Date | 12/31/2021 | 3/31/2022 | 6/30/2022 | 8/7/2022 | 8/9/2022 | 9/8/2022 | 9/30/2022 | 12/30/2022 |
| Price Per Share | $24.05 | $21.31 | $19.28 | $20.80 | $19.41 | $18.97 | $16.86 | $21.16 |
SoftBank Group Corporation Stock Price Performance Graph for 2022:
2. Netflix’s Third Quarter 2022 10-Q
Netflix is an American subscription streaming service whose 10-Q report for its third quarter revealed it had outperformed almost every analyst’s prediction. The third quarter report showed that Netflix generated $7.93 billion in revenue, $100 million over revenue projections. Netflix added 2.41 million new subscribers, which was more than double the projected number of 1.09 million subscribers. In addition to the report covering Netflix’s financial performance, it also mentioned how they will be adding a low-price ad-supported plan which they predict will bring 4.5 million new subscribers to the platform.
The publishing of this 10-Q was met with such positivity that Netflix’s stock price rose from $240.86 to $265 in after market trading. The report was so impactful because it completely turned around Netflix’s direction. For a year before the Q3 report was released, Netflix had been underperforming and was heading in a downward direction due to the growth of competitors like Hulu, Prime Video, and Disney+ with no end in sight.
Two months before the 10-Q report was released, Netflix was seeing the lowest stock prices in six years with a market cap of $78.52 billion. After the 10-Q was published, Netflix’s market cap increased and has continued to increase, bringing the company back from the trenches. Ultimately, Netflix’s 10-Q report for the third quarter of 2022, revived the company which was stuck in a downward spiral headed for certain failure.
Netflix is listed on the NASDAQ stock exchange and is a major player in many large indexes such as the Nasdaq 100, Russell 1000, NASDAQ Composite, S&P 500 Consumer Discretionary, Russell 3000, and S&P 500. Before Netflix released its 10-Q for the third quarter of 2022, Netflix’s inclusion in such indexes was significantly hurting their performance with The New York Times even calling them “the worst performing stock on the S&P 500”.
After Netflix released the 10-Q, the worry of Netflix being removed from such indexes decreased, and hope for the future of the company grew. The sudden growth of Netflix’s stock price benefitted the NASDAQ Composite Index and the other NASDAQ indexes the company is in. Although Netflix’s success benefitted the NASDAQ Composite index, it hurt the DJIA. One of Netflix’s biggest competitors is Disney, which is included in the DJIA and owns the massive streaming service Disney+.
With the resurgence of Netflix as a competitor in the streaming industry, Disney+’s growth was not as high as it should be and was being slowed down. The release of Netflix’s 10-Q coincided with a decrease of $305.47 to $304.34 per share for the DJIA. If Netflix continued on its downward trajectory, Disney+ would have grown at a higher rate meaning the decrease in the DJIA share price would have been minimized or possibly even eliminated.
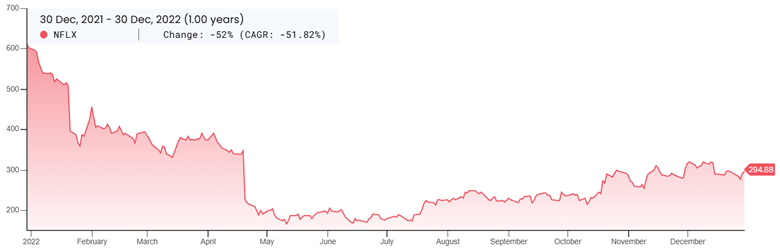
Netflix’s Stock Price Each Quarter:
| End of Previous Fiscal Year | End of First Quarter | End of Second Quarter | End of Third Quarter | Day Before The Selected Report Was Filed | Day After Selected Report Was Filed | 1 Month After The Report Was Filed | End of Current Fiscal Year | |
| Date | 12/31/2021 | 3/31/2022 | 6/30/2022 | 9/30/2022 | 10/17/2022 | 10/19/2022 | 11/18/2022 | 12/30/2022 |
| Price Per Share | $602.44 | $374.59 | $174.87 | $235.44 | $245.10 | $272.38 | $287.98 | $294.88 |
Netflix’s Stock Price Performance Graph for 2022:
3. Facebook’s Fourth Quarter 2021 10-Q
Facebook is the largest online social media and networking platform in the world. It is owned by the parent company Meta Platforms, which was created on October 28, 2021, after the name was changed from Facebook to Meta. The fourth quarter report of 2021 released alarming information to the general public. For the first time in the history of Facebook, it has lost users with the amount of daily active users decreasing by 500,000.
Even with revenue overperforming Wall Street’s predictions by $270 million, Meta’s stock price fell around 25% in after-hours trading and the company’s market cap dropped upwards of $150 billion within a few days after the 10-Q’s release. Also in Facebook’s 10-Q, the company stated that they expect to make between $27-29 billion in revenue in the first quarter of 2022, which is significantly below the analysts’ predictions of $30.15 billion.
Facebook’s release of its fourth quarter 10-Q was impactful because it demonstrated the aging and weakening of a social media giant. The massive drop in Meta’s stock price and market cap was a direct result of Facebook’s lackluster fourth-quarter performance. Facebook attributed its poor performance to a decrease in advertising spending as a result of inflation, supply chain issues, and Apple’s new IOS system.
On May 3, 2021, Apple released IOS 14.5.1 which contained a small update. According to Apple Support, “this update fixes an issue with App Tracking Transparency where some users who previously disabled Allow Apps to Request to Track in Settings may not receive prompts from apps after re-enabling it.” This means that third-party apps cannot track users’ data without their approval and the app can’t lead users into granting approval through the use of popups. The lack of data collection stops Meta’s ability to personalize its ads, meaning ads become less effective, and advertisers have begun to spend less money.
The release of IOS 14.5.1 caused a more significant change in quarter 4 of 2021, even though it was released during quarter 2 because the update takes time to grow as more and more iPhone users install it. A large number of users do not implement IOS updates immediately and with the iPhone 13 being released with the 14.5.1 software in September 2021, the number of users with this data collecting ban only continued to increase dramatically in the 4th quarter to the point it created a significant hit to Meta’s operations.
In addition, Facebook’s core news feed has begun to generate less revenue as competing social media platforms, specifically Tik Tok, have been growing exponentially. Ultimately, Facebook’s fourth quarter 10-Q from 2021 was impactful because it showed the slowing of Facebook for the first time while simultaneously telling the public that it can no longer keep up with the growth it has maintained in the past due to it struggling to keep up with new regulations. The report demonstrated Facebook’s extreme vulnerability to new competitors and struggles to adjust to the times.
Meta is the 9th largest company traded on the NASDAQ stock exchange with a market cap of $319.80 billion. Meta’s reporting of its 4th quarter financials from 2021 caused the stock price to plummet, and with Meta’s stock falling many of the NASDAQ indexes it is included in also fell, such as the S&P 500. With Meta being a major player in the market due to its large market cap, the NASDAQ Composite Index, a market cap-weighted index, suffered as a result of Meta’s failing stock price with the index’s share price decreasing from $56.21 to $54.23.
Meta has no direct relationship to the DJIA with it not being included as one of the 30 major companies and no financial services companies included in the index owning a major stake. The major institutional shareholder of Meta, BlackRock, who owns 6.6% of Meta’s outstanding shares, is listed on the NYSE and is a direct competitor of numerous companies on the DJIA such as Goldman Sachs and JP Morgan. With Meta performing poorly and its stock price plummeting, BlackRock’s holdings in the company decreased in value dramatically which benefited their competitors included in the DJIA.
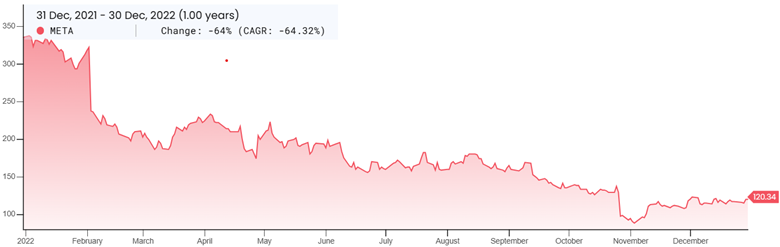
Meta’s Stock Price Each Quarter:
| End of Previous Fiscal Year | Day Before The Selected Report Was Filed | Day After Selected Report Was Filed | 1 Month After The Report Was Filed | End of First Quarter | End of Second Quarter | End of Third Quarter | End of Current Fiscal Year | |
| Date | 12/31/2021 | 2/1/2022 | 2/3/2022 | 3/2/2022 | 3/31/2022 | 6/30/2022 | 9/30/2022 | 12/30/2022 |
| Price Per Share | $336.35 | $319.00 | $237.76 | $208.11 | $222.36 | $161.25 | $135.68 | $120.34 |
Meta’s Stock Price Performance Graph for 2022:
4. Snapchat’s Second Quarter 2022 10-Q
Snap Inc. is the parent company of Snapchat, an American social media company and the 5th most utilized social media platform in the world. In the second quarter of 2022, Snapchat’s 10-Q showed that they underperformed in predicted revenue, but only by $30 million, while exceeding the projected number of active users on the app reaching 344.2 million.
With an increase in users, one might assume that the company would be growing, but this was not the case. Within the 10-Q the company states that they expect the revenue for the next quarter to be flat meaning that it will not grow. In addition to that statement, the 10-Q showed a $422 million loss which led to management saying they will substantially reduce hiring. Upon the report being released the company’s stock price dropped 26% in after-hours trading and 38% within a week.
Snapchat’s second quarter 10-Q was so impactful because it showed the power that Apple now holds over all social media platforms’ advertising ability. At the time of the 10-K’s release, Apple updated its operating system over a year ago, and the new system prevented Snapchat from tracking users and collecting their data. Since Snapchat cannot personalize its ads to a specific user, ads have become less effective, and advertisers have begun to spend less money. The report shows Snapchat’s repeated attempts at trying to generate revenue with the new operating system and displays that these attempts have failed.
By Snapchat stating that it will be downsizing and expecting revenue for the next quarter to be flat, the company is revealing that they have not solved the problem of increasing advertising revenue and have no plans to solve it anytime soon. Overall, the report is impactful because it alerted the public about how social media companies will struggle to increase revenue with the new Apple operating system in place and how it will take time before companies find a way to successfully coexist with it.
Snap Inc. is traded on the NYSE and is not currently listed on the DJIA. The release of Snap Inc’s quarterly report made the stock price drop dramatically, and although it does not affect any company included in the DJIA directly, its relationship with Apple does affect it. Even though Apple’s IOS 14.5.1 update prevents third-party apps from collecting users’ data, it does not stop Apple from collecting their data, meaning that the information Apple collects from users is becoming increasingly more valuable.
At the time of Snap Inc’s 10-Q release, the new IOS update has been out for about a year, meaning an appropriate amount of time has passed with the update gaining a substantial amount of users and companies being given more than enough time to come up with an adequate solution to this problem. Snapchats 10-Q however demonstrated that they have failed to fix their situation and that users’ personal information is extremely important.
Since Apple is the only company that now has access to this information, the company is more powerful than ever. With Apple’s growing influence and it controlling 2.84% of the DJIA and being a major player in the NASDAQ Composite Index with it having the largest market cap of $2.067 trillion, Snapchat’s 10-Q allowed for Apple’s growing power to be displayed which benefits the Composite Index and DJIA.
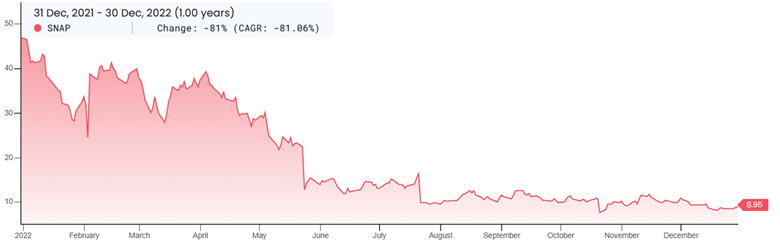
Snap Inc’s Stock Price Each Quarter:
| End of Previous Fiscal Year | End of First Quarter | End of Second Quarter | Day Before The Selected Report Was Filed | Day After Selected Report Was Filed | 1 Month After The Report Was Filed | End of Third Quarter | End of Current Fiscal Year | |
| Date | 12/31/2021 | 3/31/2022 | 6/30/2022 | 7/20/2022 | 7/22/2022 | 8/21/2022 | 9/30/2022 | 12/30/2022 |
| Price Per Share | $47.03 | $35.99 | $13.33 | $14.15 | $9.96 | $10.82 | $9.82 | $8.95 |
Snap Inc’s Stock Price Performance Graph for 2022:
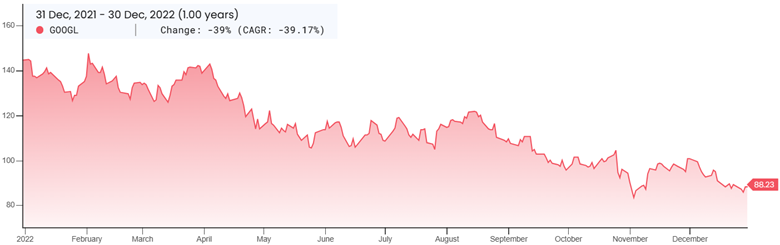
5. Alphabet’s Third Quarter 2022 10-Q
Alphabet is a multinational technology conglomerate that acts as a parent company for massive corporations such as Google and Youtube. In the third quarter of 2022, Alphabet released its 10-Q, which showed that its revenue increased 6%, compared to the third quarter of last year, to reach $65.1 billion, but was still less than expected.
In addition, Youtube’s advertising revenue was $250 million below expected with it even decreasing 2% compared to its previous quarter with analysts expecting it to increase 3%. News of Youtube’s poor performance caused Alphabet’s stock to drop 7% in extended trading to drop below $97, which was within $1.35 of its lowest close in over a year.
The 10-Q was impactful because it influenced major changes in Alphabet, the company with the 4th largest market cap and a top 100 most employed company in the world. The dramatic drop in Youtube’s advertising revenue that led to a decrease in Alphabet’s stock price, set Alphabet on a completely new uncharted path. After the release of the 10-Q, Sundar Pichai, the CEO of Alphabet, said that he will be trying to make the company 20% more efficient, which will most likely be done by laying employees off and cutting products.
The cutting of products immediately occurred with Google canceling the next generation of the Pixelbook laptop, stopping funding to its Area 120 incubator, and halting its gaming service. These actions can be viewed as dramatic and rash and the publishing of the 10-Q can be viewed as important because it severely altered company plans and demonstrated Alphabet’s strong reliability on its second-largest asset, Youtube, which is shrinking in popularity due to a growing list of competitors.
Alphabet has the third largest market cap on the NASDAQ with the company being worth $1.33 trillion. With it possessing such a large market cap, it holds great influence within the market cap-weighted NASDAQ Composite Index. With Alphabet’s 10-Q revealing that it was struggling, the Composite Index was negatively affected due to a major factor of its performance pulling it downward. Prior to the 10-Q’s release, on July 15, 2022, Alphabet experienced a 20 to 1 stock split and the lowering of the stock price led many to conclude that it was soon to be added to the DJIA since it is a price-weighted index, but with the 10-Q showing Alphabet’s poor performance, these rumors were squashed. With the lack of the expected addition of Alphabet to the DJIA, the DJIA was able to perform at a higher level without it being dragged down by the struggling stock price of Alphabet.
Alphabet’s Stock Price Each Quarter:
| End of Previous Fiscal Year | End of First Quarter | End of Second Quarter | End of Third Quarter | Day Before The Selected Report Was Filed | Day After Selected Report Was Filed | 1 Month After The Report Was Filed | End of Current Fiscal Year | |
| Date | 12/31/2021 | 3/31/2022 | 6/30/2022 | 9/30/2022 | 10/24/2022 | 10/26/2022 | 11/25/2022 | 12/30/2022 |
| Price Per Share | $144.85 | $139.07 | $108.96 | $96.65 | $102.52 | $94.93 | $97.46 | $88.23 |
Alphabets’s Stock Price Performance Graph for 2022:
 All graphs are courtesy of Stratosphere.io